Forgot Password
Pentax Camera Forums Home
 

Reply
Show Printable Version Search this Thread
11-08-2011, 07:36 AM   #1
Inactive Account


Join Date: Apr 2010
Location: New Orleans
Photos: Gallery
Posts: 3,053
Wealth Distribution in an egalitarian society

So I got to thinking that in an egalitarian society where every worker earned the same amount, you would still have massive wealth inequality. To test that I went ahead and created a model where you have 5 households, 3 households with only 1 worker and 2 households with 2 workers. Every worker (man or woman) earns $50,000/year and this society has realized the benefits of MMT so there are no taxes there is no inflation and everyone has free health care. All debts have been wiped out, there is zero unemployment, and people do not go into debt. People are still free to save money and if they save they can earn a 3% annual return and everyone saves at least a little bit.

The household income distribution is not completely equal because not everyone is in a dual income household and some dual income households choose not to have both people working.
Attachment 108526

Assuming different people choose different savings rates and being in a dual income household lets you save more, this is what the wealth distribution would look like after 1 year in this society.
Attachment 108527

If people continue this trend for 20 years with 5 new households coming into existence each year and following the same trends so you would have 100 total households. The wealth distribution would become concentrated into the hands of the older households especially if they were dual income households.
Attachment 108528

And after 40 years wealth is even more concentrated...
Attachment 108529

Here are the data tables behind the above graphs.
Attachment 108525


Last edited by mikemike; 01-31-2014 at 12:36 AM.
11-08-2011, 07:59 AM   #2
Veteran Member
Nesster's Avatar

Join Date: Oct 2006
Location: NJ USA
Photos: Gallery
Posts: 13,072
Yes, this is a nice mathematical model of laissez-faire policy... and the effects of saving a portion of your income annually.

Please note that if you assume a more progressive tax rate on the $100K people, you put a slight dent in their savings rates.

In reality, of course, an egalitarian society has income differences as well as wealth differences. Apart from tax policy, what moderates the extremes in these systems: there is a floor to how poor you can be, and this removes some of the need to accumulate wealth. Through more equal starting points (e.g. free quality education) there is more possibility of overcoming birth-disadvantage. And plain old social pressure or mores: in a society that doesn't see great wealth as an end in itself (or desireable) the 1st decile won't be as tempted to beging paying itself more as time goes on.
11-08-2011, 08:13 AM   #3
Veteran Member
jeffkrol's Avatar

Join Date: Sep 2006
Location: Wisconsin USA
Photos: Gallery
Posts: 8,434
Keep going............... why stop at 40. See what happens in 100-200 years. Tell me when it has to inevitably collapse in chaos, death, and/or tyranny.........
As it is it looks pretty much like the US over it's 200 plus years.. so much for thinking we are "socialists" except to prevent a more rapid decay......
In one sense you are right.. it is "inevitable" as is entropy and a petrie dish of bacteria starving itself out of existence. The "trick" (and human difference) is to buck the trend and create a more "fair and balanced" society.
Or it should be.......

Last edited by jeffkrol; 11-08-2011 at 08:21 AM.
11-08-2011, 08:21 AM   #4
Veteran Member
GeneV's Avatar

Join Date: Oct 2008
Location: Albuquerque NM
Photos: Albums
Posts: 9,830
There will always be unequal wealth, and that it is not really a problem to any of us.

There appears to be no country in the world where people of the median income save 20% of their income, so why go there? My assumption would be that such society would have many of the things upon which a family must spend money here are provided in some other way. Health care comes to mind, since, with family coverage at ~$900 per month, that ends up being about 20% of the family's income at $50k.

When I checked I found that in 2010, Spain had the highest savings rate in the world, at 17%, followed by France at 15%. All of the top 10 countries are social democracies of the EU. After Germany at No. 5, no other country gets into double figures. Really, there should be much smaller differences calculated out, since the U.S. average is around 4% over the last 20 years.

So, to get the equal opportunity to save something like the rates Mike has calculated, it would appear there needs to be a floor of services. That floor allows a society in which inequality of wealth may be more the result of choices.


Last edited by GeneV; 11-08-2011 at 08:39 AM.
11-08-2011, 08:50 AM   #5
Inactive Account


Join Date: Apr 2010
Location: New Orleans
Photos: Gallery
Posts: 3,053
Original Poster
If you average it out, the savings rate of this model society is 17% and that is seriously buoyed by the fact that the government doesn't levy any income taxes, provides free healthcare, no one take on debt, and everyone saves at least something. China has much higher household savings rates than any of those European countries mentioned or even this model.

In the US, the bottom ~10% of households in terms of net worth have so much debt that they negate the modest but positive net worth of households ~11-30%. That is a problem I wanted to avoid.

I only went out to 40 years because I wanted to see only 1 lifetime of working without worrying about the effects of inheritance.
11-08-2011, 08:53 AM   #6
Veteran Member
jeffkrol's Avatar

Join Date: Sep 2006
Location: Wisconsin USA
Photos: Gallery
Posts: 8,434
QuoteOriginally posted by mikemike Quote
I only went out to 40 years because I wanted to see only 1 lifetime of working without worrying about the effects of inheritance.
Keep going.......... for fun......

O/T best Freudian slip this year..........

Romney wants to cut pay, workforce of government 'servants'

11-08-2011, 09:17 AM   #7
Veteran Member
GeneV's Avatar

Join Date: Oct 2008
Location: Albuquerque NM
Photos: Albums
Posts: 9,830
QuoteOriginally posted by mikemike Quote
If you average it out, the savings rate of this model society is 17% and that is seriously buoyed by the fact that the government doesn't levy any income taxes, provides free healthcare, no one take on debt, and everyone saves at least something. China has much higher household savings rates than any of those European countries mentioned or even this model.

In the US, the bottom ~10% of households in terms of net worth have so much debt that they negate the modest but positive net worth of households ~11-30%. That is a problem I wanted to avoid.

I only went out to 40 years because I wanted to see only 1 lifetime of working without worrying about the effects of inheritance.
When you inject China into the picture, you inject more questions than answers. http://www.bis.org/publ/work312.pdf The manipulation in China makes any comparison difficult to impossible.

Yes, people will accumulate different amounts of wealth over the years if their society allows them the ability to save and they choose radically different savings rates. I would suspect that you would not see an entire quintile at 1% with an entire quintile at 20% among people who make the median household income. On the other hand, even those calculations do not result in 1% owning ~40% of the total wealth of the society.

11-08-2011, 12:23 PM   #8
Pentaxian
redrockcoulee's Avatar

Join Date: Nov 2009
Location: Medicine Hat
Posts: 2,306
Mike

Pay a visit to a Hutterite colony
11-08-2011, 01:10 PM   #9
Inactive Account


Join Date: Apr 2010
Location: New Orleans
Photos: Gallery
Posts: 3,053
Original Poster
Wow, I just looked back at that PBS story from before about inequality and found a huge misrepresentation that they made and which has been perpetuated.

The three charts they present:


QuoteQuote:
PAUL SOLMAN: At least he got that one right. The completely equal pie economy is completely made up.

The middle pie represents the wealth distribution of Sweden. The bottom pie? We asked two presumably low-income workers near the tourist line for "Letterman."
The first one of equal distribution is totally fabricated, the second one is actually of Sweden's Income Distribtion not wealth distribution as was stated in the story and has been repeated countless other places.

From the source research by Ariely and Norton which inspired the newshour report:
QuoteQuote:
We used Sweden’s income rather than wealth distribution because it provided a clearer contrast to the other two wealth distribution
examples; although more equal than the United States’ wealth distribution, Sweden’s wealth distribution is still extremely top heavy.
http://www.people.hbs.edu/mnorton/norton%20ariely%20in%20press.pdf

It took some digging because if you search for "Sweden Wealth Distribution" everything seems to be linked to the misrepresented income distribution. Google Pagerank Fail do to a big lie.

Here is Sweden's Actual Wealth Distribution:

http://www.thefiscaltimes.com/Articles/2011/03/25/Wealth-Debate-How-Two-Econ...eck.aspx#page1

As the authors said in their not it is more equal than the US but still extremely top heavy, probably much more so than most who have fallen in love with Sweden's income distribution would like to admit.
11-08-2011, 01:26 PM   #10
Inactive Account


Join Date: Apr 2010
Location: New Orleans
Photos: Gallery
Posts: 3,053
Original Poster
Also interesting, I think I have seen this chart around here before...

Who Rules America: Wealth, Income, and Power

Oddly, the "estimated" lines up with the 20 year run where the top quintile ends up owning 59% of the wealth, the next quintiles owning ~21%, ~11%, ~7%, and ~3%.
11-08-2011, 01:28 PM   #11
Veteran Member
jeffkrol's Avatar

Join Date: Sep 2006
Location: Wisconsin USA
Photos: Gallery
Posts: 8,434
What's your point. They still don't have the dual debt burden of health care and education...........
Who RulesAmerica
Percentage of wealth held by the Top 10% of the adult population in various Western countries
country wealth owned
by top 10%
Switzerland 71.3%
United States 69.8%
Denmark 65.0%
France 61.0%
Sweden 58.6%
UK 56.0%
Canada 53.0%
Norway 50.5%
Germany 44.4%
Finland 42.3%
QuoteQuote:
There's a much deeper power story that underlies the self-dealing and mutual back-scratching by CEOs now carried out through interlocking directorates and seemingly independent outside consultants. It probably involves several factors. At the least, on the worker side, it reflects an increasing lack of power following the all-out attack on unions in the 1960s and 1970s, which is explained in detail by the best expert on recent American labor history, James Gross (1995), a labor and industrial relations professor at Cornell. That decline in union power made possible and was increased by both outsourcing at home and the movement of production to developing countries, which were facilitated by the break-up of the New Deal coalition and the rise of the New Right (Domhoff, 1990, Chapter 10). It signals the shift of the United States from a high-wage to a low-wage economy, with professionals protected by the fact that foreign-trained doctors and lawyers aren't allowed to compete with their American counterparts in the direct way that low-wage foreign-born workers are.

On the other side of the class divide, the rise in CEO pay may reflect the increasing power of chief executives as compared to major owners and stockholders in general, not just their increasing power over workers. CEOs may now be the center of gravity in the corporate community and the power elite, displacing the leaders in wealthy owning families (e.g., the second and third generations of the Walton family, the owners of Wal-Mart). True enough, the CEOs are sometimes ousted by their generally go-along boards of directors, but they are able to make hay and throw their weight around during the time they are king of the mountain. (It's really not much different than that old children's game, except it's played out in profit-oriented bureaucratic hierarchies, with no other sector of society, like government, willing or able to restrain the winners.)

The claims made in the previous paragraph need much further investigation. But they demonstrate the ideas and research directions that are suggested by looking at the wealth and income distributions as indicators of power.
11-08-2011, 01:43 PM   #12
Inactive Account


Join Date: Apr 2010
Location: New Orleans
Photos: Gallery
Posts: 3,053
Original Poster
The point is that if someone were to show you the US Income distribution vs. Sweden's Wealth Distribution and pretend that they were both distributions of the same measure you would prefer the US vs. Sweden.


Also absent is the amount of dollars represented by each percent. If you looked at the distribution of income in Cuba where it is 20% for each quintile vs. the Distribution for america you would say you prefer the distribution for Cuba. When you find out that 20% of the Cuban Pie is equal to 1% of the american pie, does that change your preference?
11-08-2011, 01:51 PM   #13
Veteran Member
Nesster's Avatar

Join Date: Oct 2006
Location: NJ USA
Photos: Gallery
Posts: 13,072
... and facts are what they are. The point, Mike and Jeff, isn't so much how much 
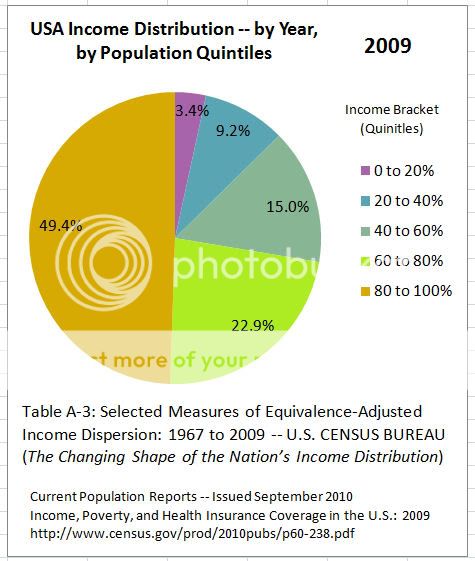
wealth is concentrated, but how well the society functions with that concentration. In other words, what things serve to make this more platable to the majority, and to make for a less polarized economy?

One, is the income equaltiy - the less of a gradient here, the less of a difference in daily life, and the more economic mobility in income terms is possible

Two, is the services equality - the less of an advantage there is to very high incomes in getting health care, education, a decent retirement, the less impact of high wealth and/or income. And yes, over time as societies and technologies develop, more items fall into the services equality bucket. These services also tend to reinforce economic mobility.

And economic mobility here is a good thing - for this ensures the best qualified and able can rise to more impactful positions, vs. in a system where ability can be more easily swamped out by conditions of birth.

Third, there's a social equality style that doesn't look at wealth or fame as the primary differentiator. In other words, for ego driven strivers, making a ton of money and being an a-hole about it isn't the only way to fill that void they feel...

Fourth, and this is currently uppermost due to the bad economy now, and for the past 10 or more yeas for the 'common' wage earner: Pie Growth equality. That is, as the GDP grows, all deciles get some of the benefit... the benefits do not accrue to those at the top in an overly abundant way. And when the pie shrinks, the bottom loses less... In general, as the pie shrinks, these resentments and grabs come out.

When I say 'equality' above I do not mean a rigid 'everyone gets the same' or 'everyone within 20%' type of equality... there will always be market and tradition based differences... it is relative equality, a concept that will change over time and across societies, of what feels 'fair'. With the Scandinavian countries and Japan for example, the societal norm of 'fair' tends to limit the upward move of the highest salaries... whereas in the US the competing ideas of 'fairness' are constantly moving, depending on which spokesmen are better at it and better funded. (I happen to think the ideas of 'fair' that came in with the first Roosevelt and then became institutionalized with the second were one of the things that permitted the long golden age from WW2 to the 1970s.)
11-08-2011, 02:04 PM   #14
Veteran Member
GeneV's Avatar

Join Date: Oct 2008
Location: Albuquerque NM
Photos: Albums
Posts: 9,830
QuoteOriginally posted by mikemike Quote
The point is that if someone were to show you the US Income distribution vs. Sweden's Wealth Distribution and pretend that they were both distributions of the same measure you would prefer the US vs. Sweden.


Also absent is the amount of dollars represented by each percent. If you looked at the distribution of income in Cuba where it is 20% for each quintile vs. the Distribution for america you would say you prefer the distribution for Cuba. When you find out that 20% of the Cuban Pie is equal to 1% of the american pie, does that change your preference?
The dollars might make a difference in Sweden, too, as would comparing wealth to wealth, rather than income to wealth as those two graphs do. Comparing the top 10% or 20% may also be misleading, because the U.S. has a very high wealth concentration in the top 1%.

A final issue is that the trend in the U.S. has accelerated in recent years. It may be that the older European countries have a good deal of concentration left over from centuries of aristocracy. The U.S. did not have this kind of wealth concentration just a few decades ago.

Last edited by GeneV; 11-08-2011 at 02:11 PM.
11-08-2011, 02:13 PM   #15
Veteran Member
Nesster's Avatar

Join Date: Oct 2006
Location: NJ USA
Photos: Gallery
Posts: 13,072
Or to put it another way:

Let's say you make $50K a year, and have received a total of $500 in raises over the last 10 years... while in order to 'save the company' many of your co-workers have been laid off, your health benefits cover less and cost more, and you lost your (small) pension and a good chunk of your 401(k) matching contribution.

Meanwhile, 10 years ago I made $500K but now I'm pulling down $1.5mill plus stock compensation. Your financial and job frustrations are simply meaningless to me... I'm not worried about my kids getting into good college (and paying for it) while for you this is a major issue. I'm on an 'executive' health plan - and can easily pay for whatever I want when it comes to health care. I really view you as a number on a spreadsheet.

In good times you'd resent me a bit, but could actually get away with not paying attention to me... In bad times you'll start to look at what your lot is vs. what is mine - and start to seriously wonder if I'm really worth all that extra money.

In a more egalitarian society, I probably would not have paid myself so much - I'd have shared the 'pain' and maybe I'd be making say $600K to your $50K. But you have security in a single payor health care system, free college (based on ability), you'd be a bit more secure about retirement and what would happen should you lose your job... and I'd argue your corporation is better off too.

This doesn't mean that I'm not accumulating more wealth - and feel more control - than you. But it doesn't stick like a thumb in your eye.
Reply

Bookmarks
  • Submit Thread to Facebook Facebook
  • Submit Thread to Twitter Twitter
  • Submit Thread to Digg Digg
Tags - Make this thread easier to find by adding keywords to it!
distribution, household, income, people, society, wealth, worker
Thread Tools Search this Thread
Search this Thread:

Advanced Search


Similar Threads
Thread Thread Starter Forum Replies Last Post
definitely not the flat earth society Lowell Goudge Pentax SLR Lens Discussion 69 12-17-2015 07:43 AM
Question What is the age distribution of our members Lowell Goudge Site Suggestions and Help 6 10-25-2011 11:08 AM
400 people in the US now have more wealth than 1/2 of all Americans combined jeffkrol General Talk 193 05-05-2011 11:22 AM
Pentax's Third new camera..... New Distribution Channel interested_observer Pentax News and Rumors 50 09-30-2010 12:23 PM
Streets Modern Society JesseDavis Photo Critique 7 06-26-2010 03:42 PM


All times are GMT -7. The time now is 08:35 AM. | See also: NikonForums.com, CanonForums.com part of our network of photo forums!
  • Red (Default)
  • Green
  • Gray
  • Dark
  • Dark Yellow
  • Dark Blue
  • Old Red
  • Old Green
  • Old Gray
  • Dial-Up Style
Hello! It's great to see you back on the forum! Have you considered joining the community?
register
Creating a FREE ACCOUNT takes under a minute, removes ads, and lets you post! [Dismiss]
Top