Hey Red,
All you need is a 1x1m grid , chuck it onto the ground, collect everything inside it smaller than a pencil, then microwave it enough to remove the moisture, then weigh the residual and convert to tonnes per hectare.
Enter the relevant data
here and then check the effect on slope.
I'm sure you guess by now that it is a simple thing to create a map showing fire danger areas calculated by slope (steeper = worse) and aspect (more northerly = worse) and add in fuel loads, and last burnt area.
Another web resource is the
DSE training site, have a look or sign up to do a course on line.
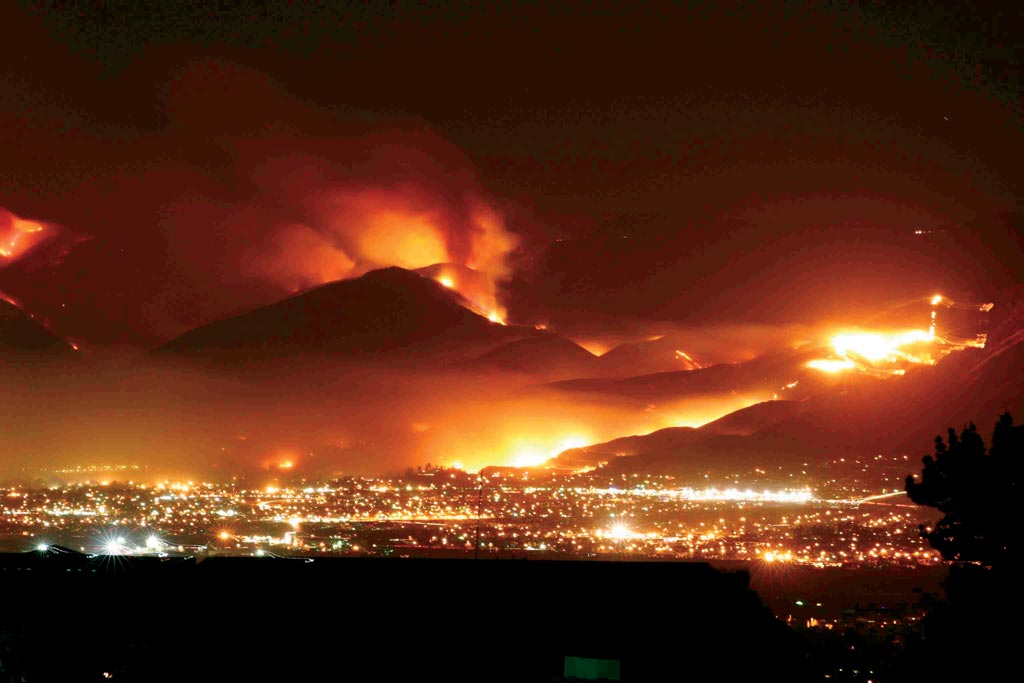
And sorry to bump the post with the latest news of more fires today, with house(s) lost. At least one of those fires will cause trouble this coming Friday when we have 39 deg forecast.
I could see the Dalesford fire from my place, 100km away. The convection column was huge.
Funny enough there was a lightning strike this arvo in the Otways that started a fire, right in the middle of a prescribed burn from two years ago! No wind, so it looks like it has been rounded up well.


 It probably won't put all the fires out, but it's a start


 Similar Threads


