
HD Pentax-D FA 100mm F2.8 ED AW Macro
Sharpness
Sharpness, or the ability to resolve small details, is an important measure of the performance of a lens. Sharp images let the viewer concentrate on the composition, color and light. On the other hand, soft images (except when looking that way on purpose) distract the viewer and decrease the perceived quality of the picture.
Like every macro, The HD D FA 100mm Macro is regarded as a top-tier lens. This comes with high expectations for sharpness. Following in the shadow of the SMC D FA 100mm Macro, the HD version has big boots to fill.
There are many ways to evaluate sharpness. Some are quantitative, such as the number of lines per millimeter that can be resolved, while others are comparative, such as using a standardized scene to pit lenses against one another. The latter is the favored method at Pentax Forums.
Test Setup, Star Chart
In order to evaluate sharpness, we photograph a standard test chart (or "star chart") that can be used to compare lenses to one another. The general rule is that the distance from the lens to the test chart must be 100 times the focal length of the lens. For our lens, this means a distance of 10 meters.
The test is not designed to show how good a lens can be. Quite the contrary: it is a stress test designed to put the lens at its limits to show where it falls short. The test shows the apertures where the lens performs best, and makes it possible to compare with another lens.
Our test has the star chart put successively at the center, edge and corner of the field of view of the lens, testing all apertures each time.
Resolution is obviously dependent on the sensor used. For this test, we used both of Pentax's current top-of-the-line sensors: the K-1 II's full frame 36 MP and the K-3 III 's APS-C 26 MP.
New Pentax DSLR bodies include the ability to disable anti-aliasing, a very useful feature allowing higher resolutions to be reached. However, the nature of our sharpness test and the pattern of the test chart mean that, with anti-aliasing totally disabled, moiré is likely to appear. In order to strike the best balance between sharpness and moiré reduction, the anti-aliasing simulators were activated and set at the "Low" setting.
We take the advantage of this test to compare results between the SMC and HD versions of the 100mm macro.
Test Results at 100mm on APS-C
The following images showcase the results at all apertures on APS-C. Focusing was performed by using focus peaking in live view. It was corrected after each lens movement. You can click on images to see full resolution crops.
Center
HD 100 Macro AW | SMC 100 Macro WR | |
F2.8 | 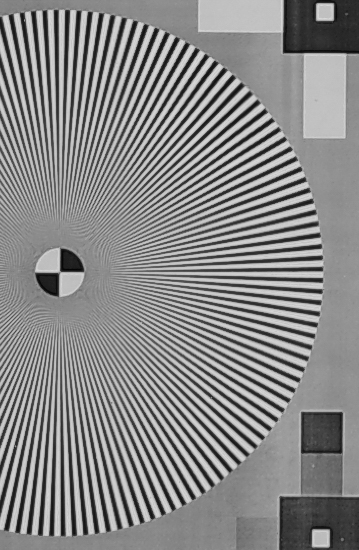 |  |
F4 |  |  |
F5.6 | 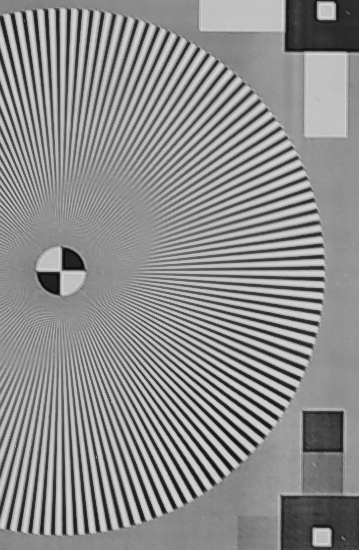 |  |
F8 |  |  |
F11 |  |  |
F16 |  |  |
F22 |  |  |
Edge
HD 100 Macro AW | SMC 100 Macro WR | |
F2.8 |  | 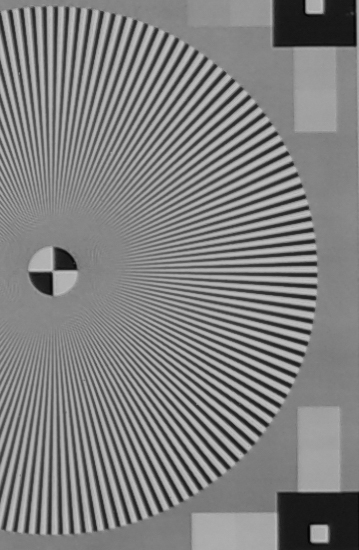 |
F4 |  |  |
F5.6 |  | 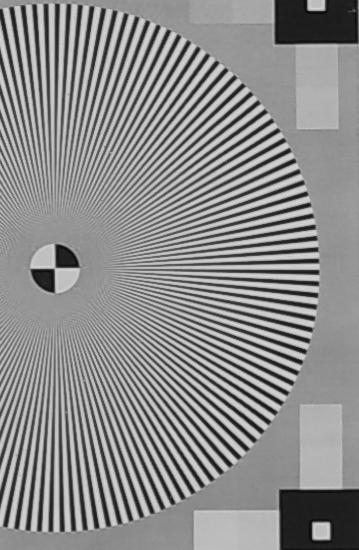 |
F8 | 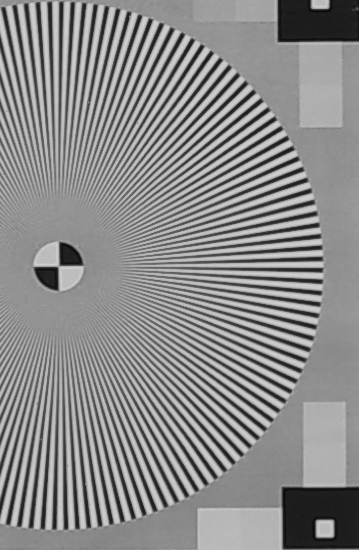 | 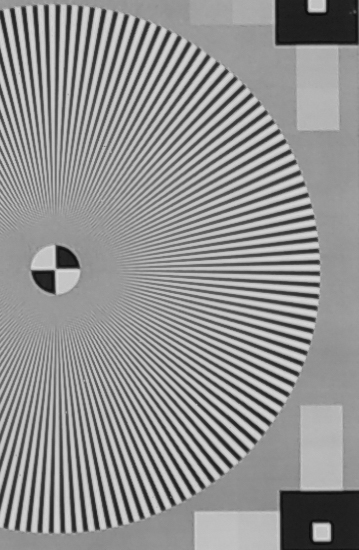 |
F11 | 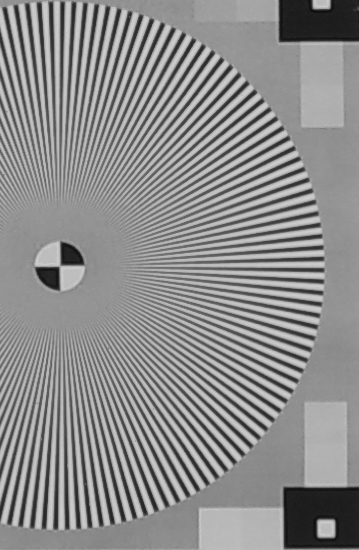 |  |
F16 | 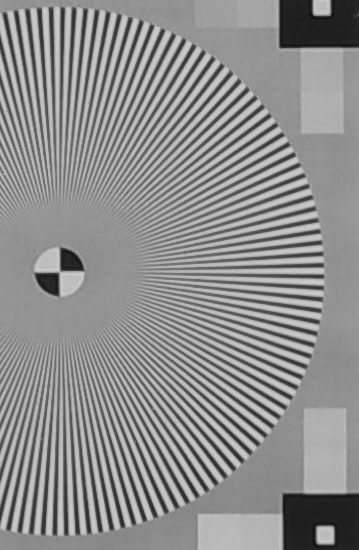 | 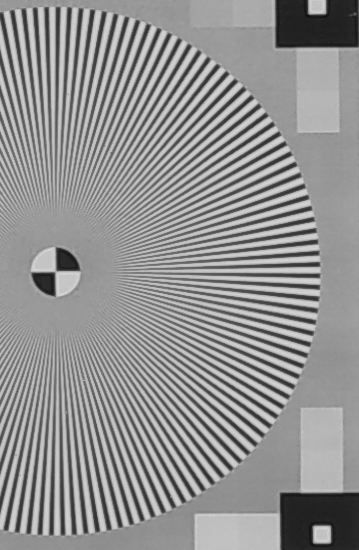 |
F22 | 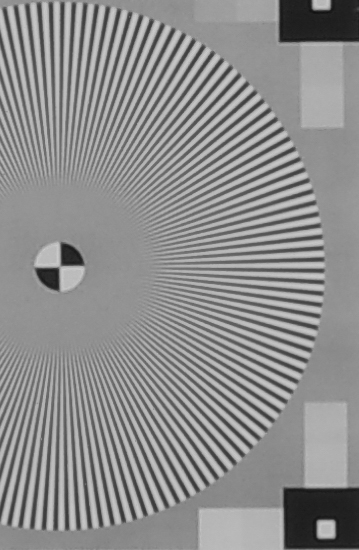 | 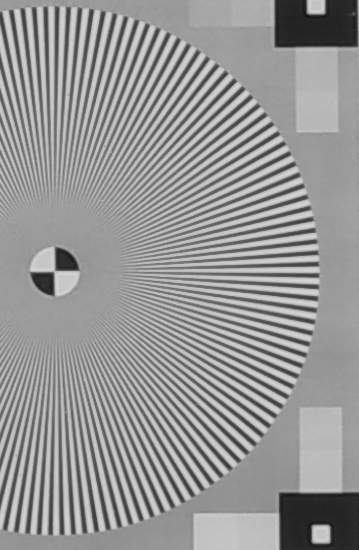 |
Corner
HD 100 Macro AW | SMC 100 Macro WR | |
F2.8 | 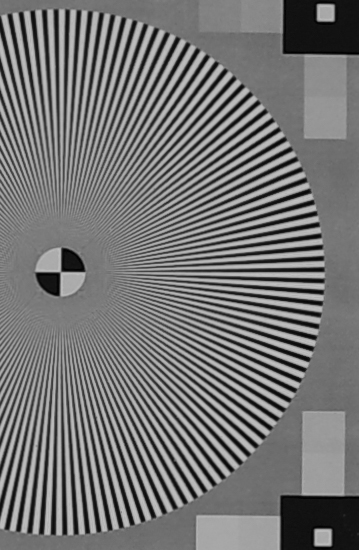 | 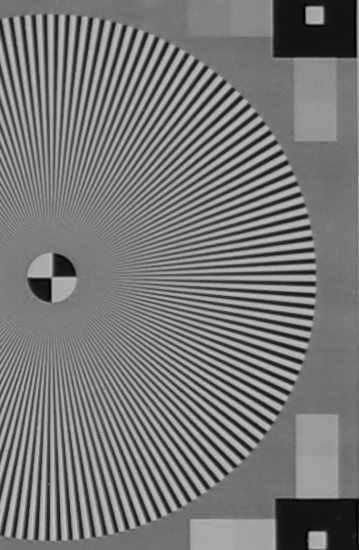 |
F4 | 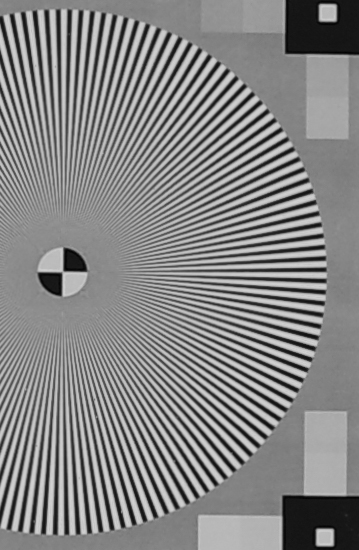 | 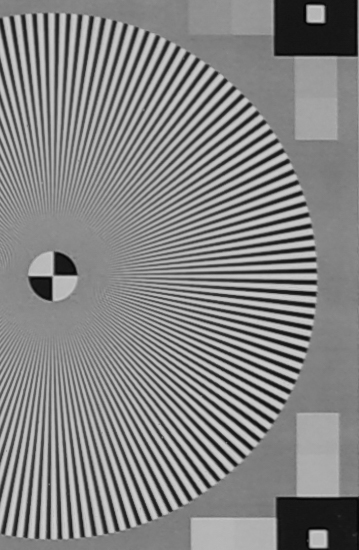 |
F5.6 | 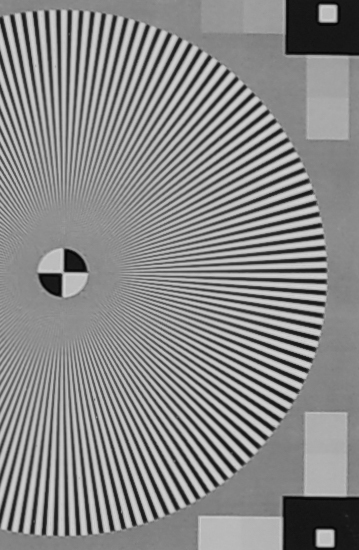 |  |
F8 |  | 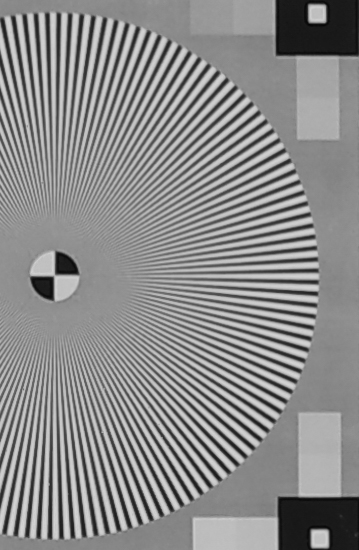 |
F11 |  | 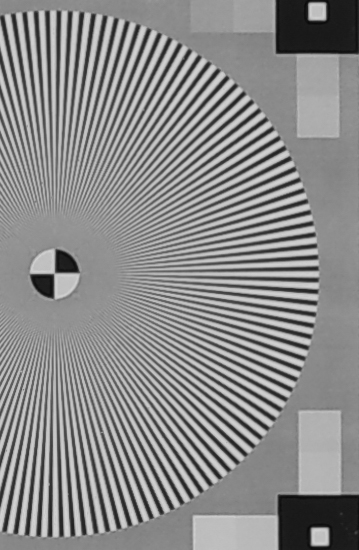 |
F16 | 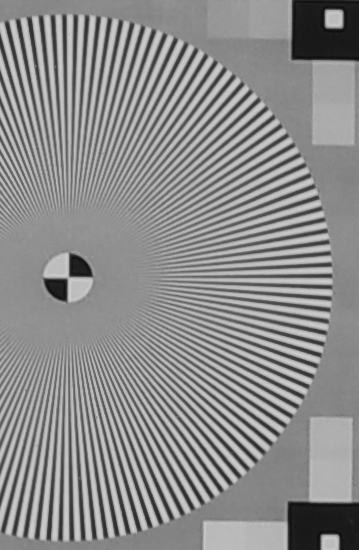 | 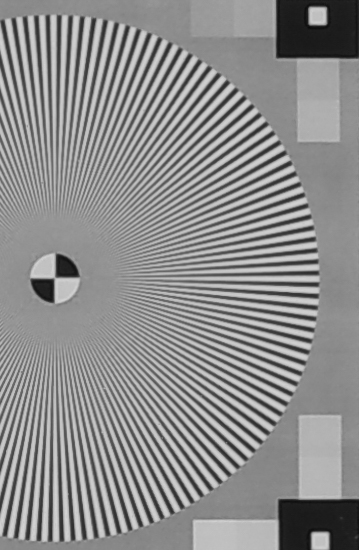 |
F22 |  |  |
Center sharpness is excellent on the two lenses, with a visible advantage to the HD version at F2.8. Beyond that, differences are minimal. Sharpness decreases a bit at F11, and more visibly at F16 and beyond.
On the edges and corners, the new design shows more important improvements. Below F5.6, the HD version is significantly superior to the SMC version. Again, sharpness decreases minimally at 11, more significantly at F16.
These results highlight that the high pixel density of the K-3 III (the highest of any Pentax camera ever) stretches the resolution capabilities of the lenses. Still, the two lenses deliver excellent resolution figures in general terms.
Test Results at 100mm on full frame
The following images showcase the results at all apertures on full frame. Focusing was performed by using focus peaking in live view. It was corrected after each lens movement. You can click on images to see full resolution crops.
Center
HD 100 Macro AW | SMC 100 Macro WR | |
F2.8 |  | 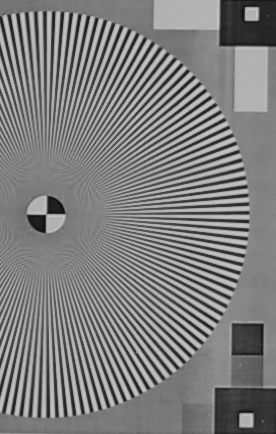 |
F4 | 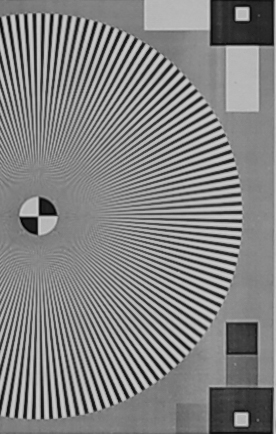 |  |
F5.6 | 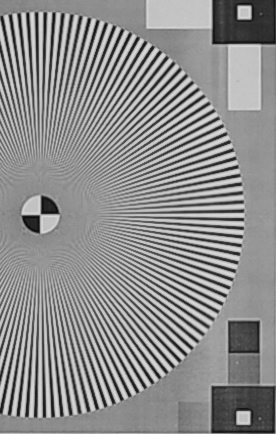 |  |
F8 | 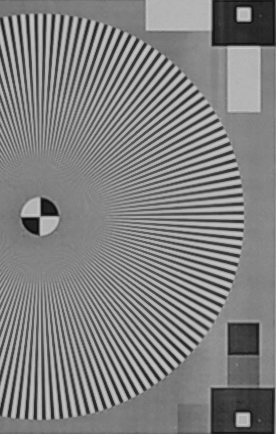 |  |
F11 | 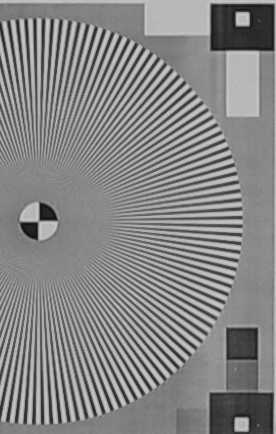 |  |
F16 |  |  |
F22 |  | 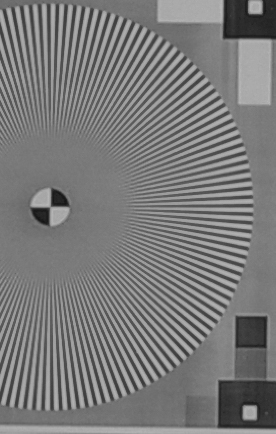 |
Edge
HD 100 Macro AW | SMC 100 Macro WR | |
F2.8 | 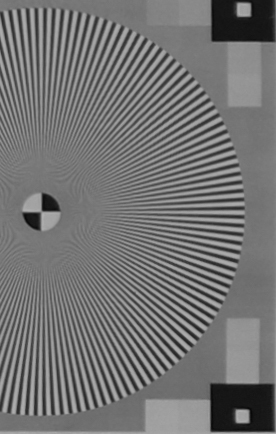 | 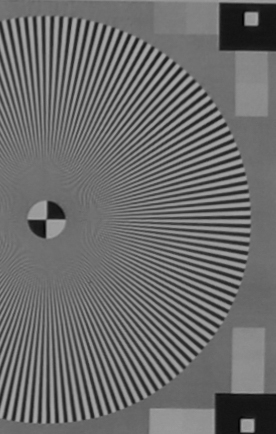 |
F4 | 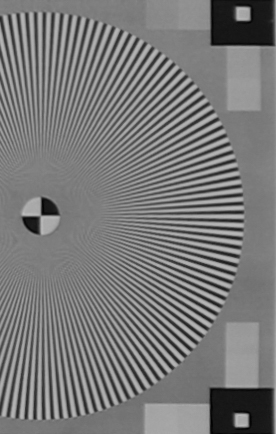 | 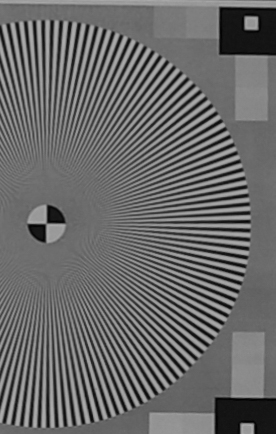 |
F5.6 | 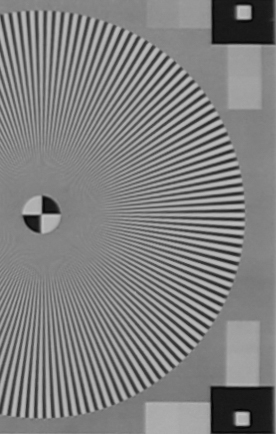 | 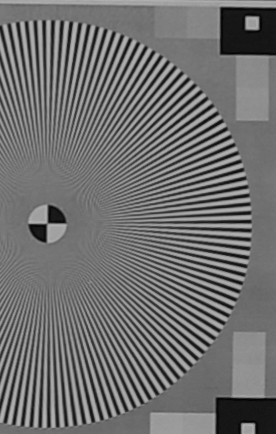 |
F8 |  |  |
F11 |  |  |
F16 | 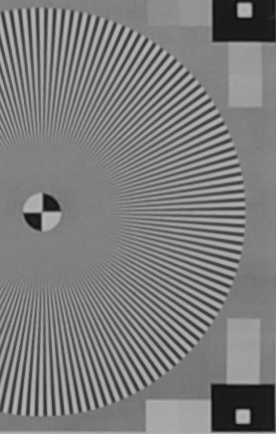 | 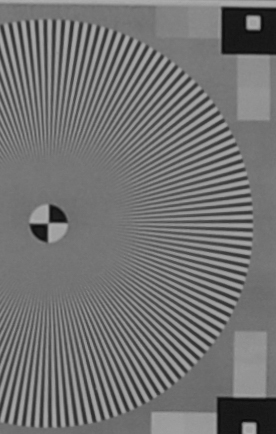 |
F22 |  |  |
Corner
HD 100 Macro AW | SMC 100 Macro WR | |
F2.8 |  | 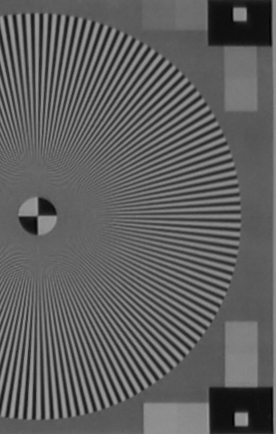 |
F4 |  |  |
F5.6 |  | 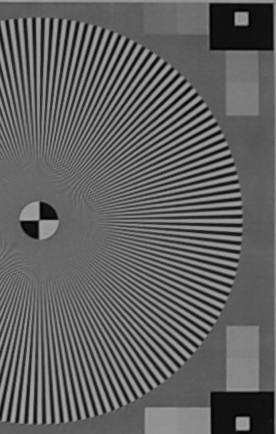 |
F8 | 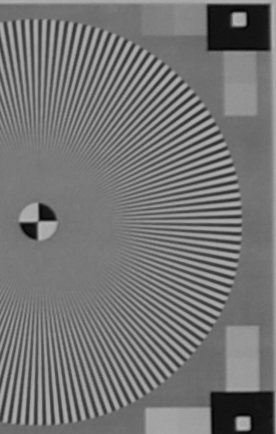 | 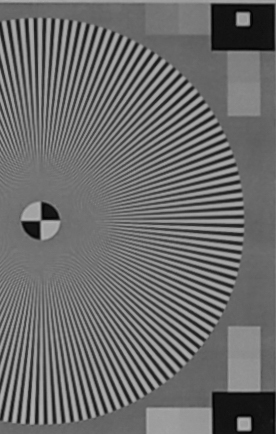 |
F11 | 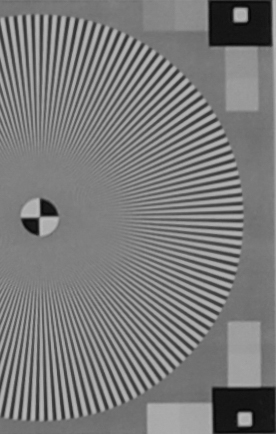 | 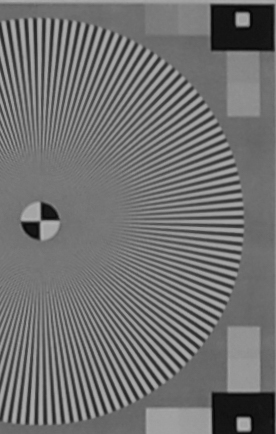 |
F16 |  |  |
F22 |  |  |
Results in the center are similar to those on APS-C. The HD lens does better than the SMC at F2.8 and the two lenses are mostly similar at smaller apertures. Starting at F11, and more so at F16, some softness appears.
Edges and corners are visibly softer than the center. They are not soft, but resolution is not as high as in the center. In the corners, the SMC lens appears a tiny bit sharper but this is really splitting hairs. The two lenses produce excellent sharpness in general terms.
Real-life test
Test charts never tell the whole story. The following images illustrate the performance of the lens with a real-life test subject with a lot of detail. We used a close distance to differentiate with the star chart tests, which are performed at a significant range. We moved our camera to place the subject in the center, the edge and then corner, refocusing between each shot.
Test Results at 100mm on full frame
The following images showcase the results at all apertures on full frame. Findings will be applicable to APS-C, following the conclusions of the previous section. Focusing was performed by using focus peaking in live view. It was corrected after each lens movement. You can click on images to see full resolution crops.
Center
HD 100 Macro AW | SMC 100 Macro WR | |
F2.8 | 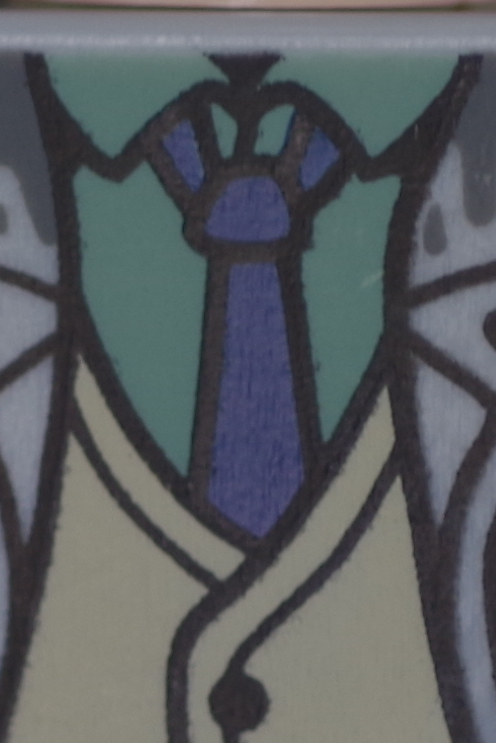 | 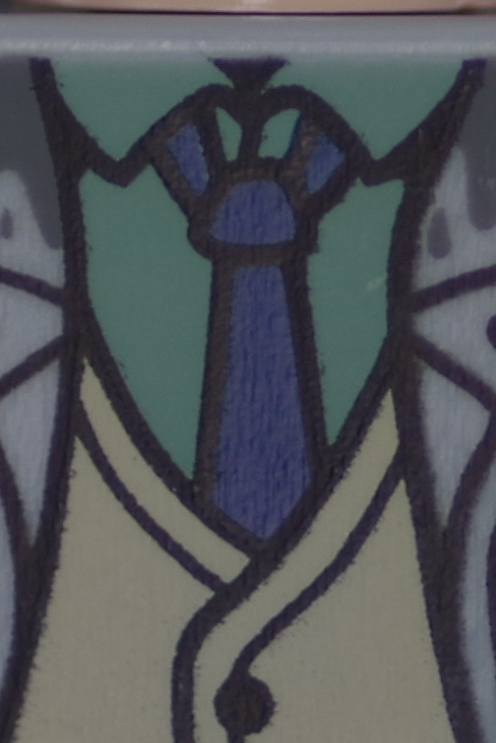 |
F4 | 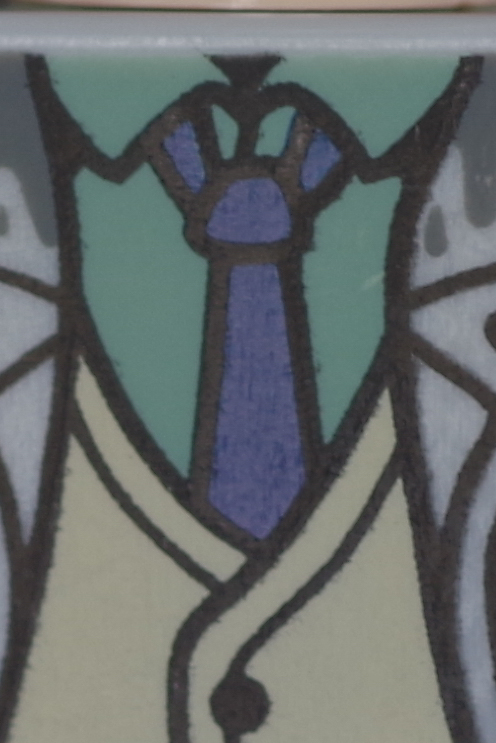 | 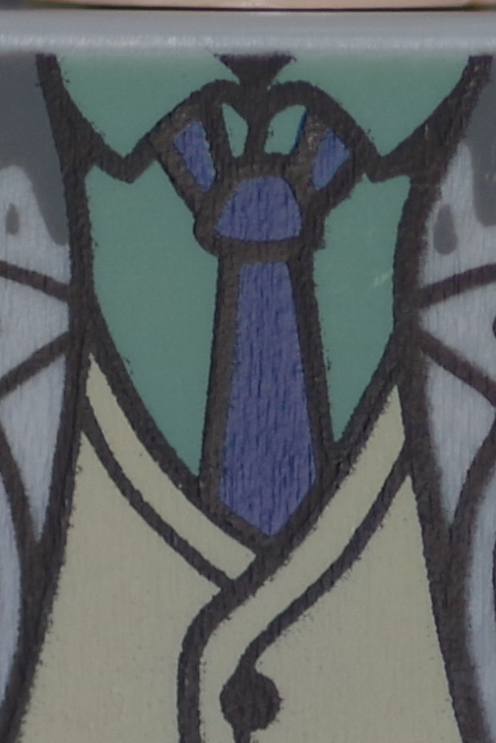 |
F5.6 | 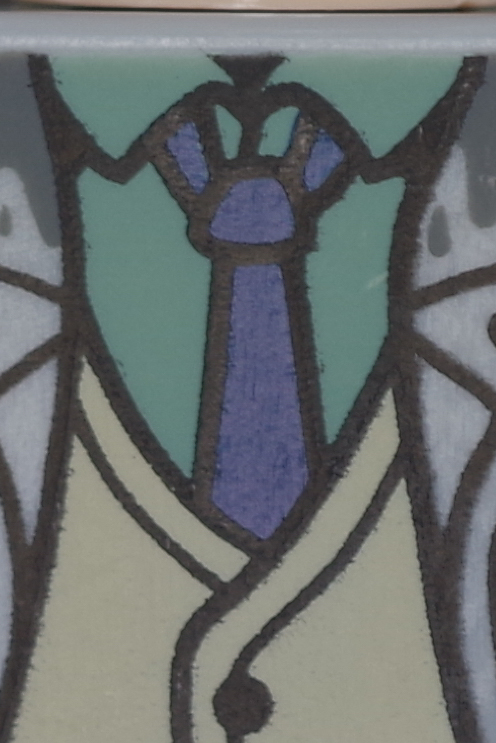 | 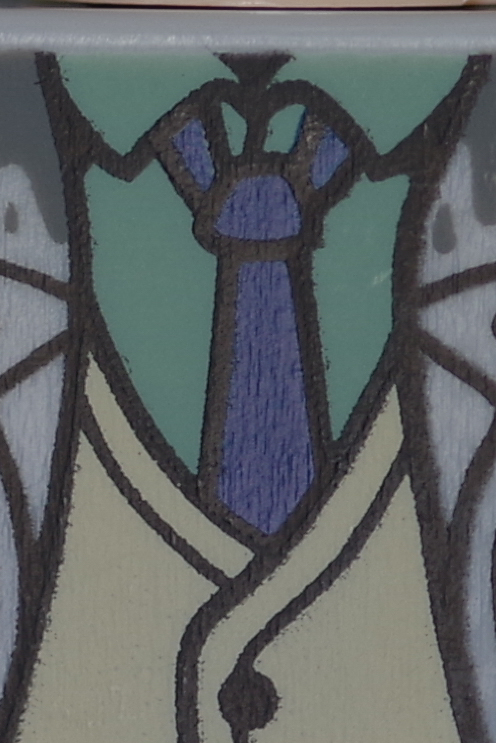 |
F8 |  | 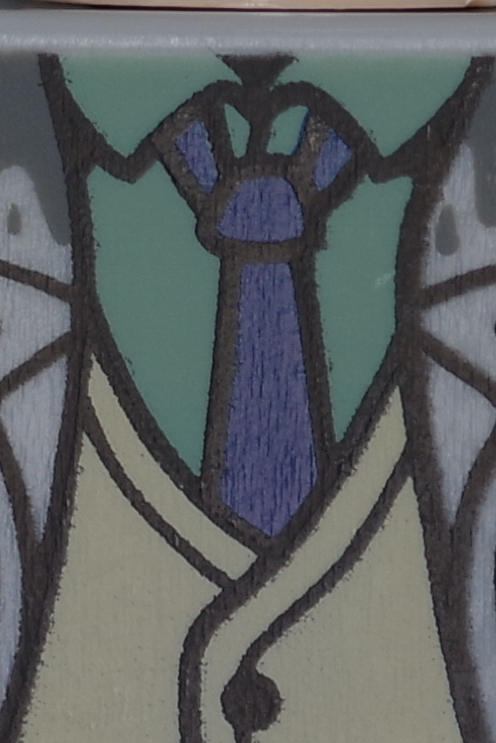 |
F11 | 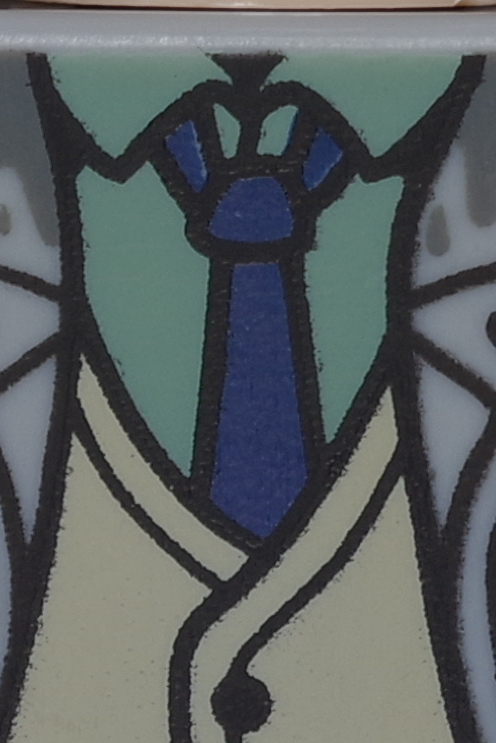 | 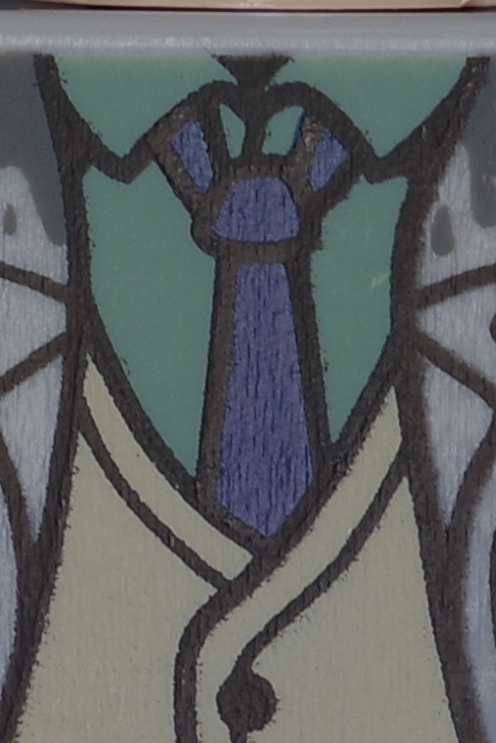 |
F16 | 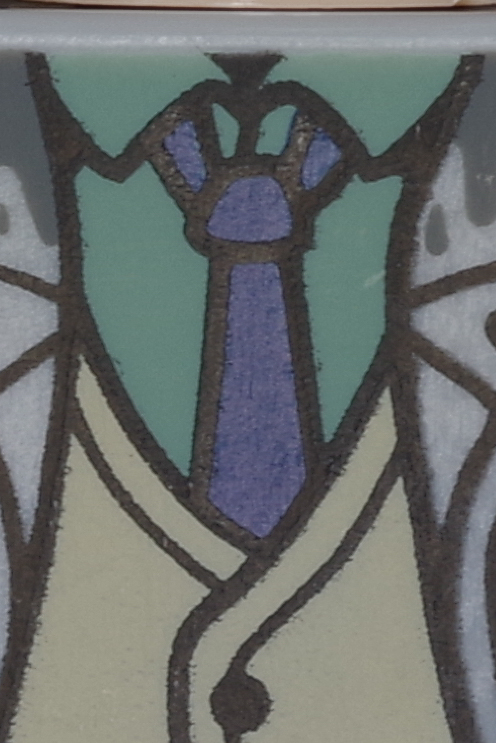 | 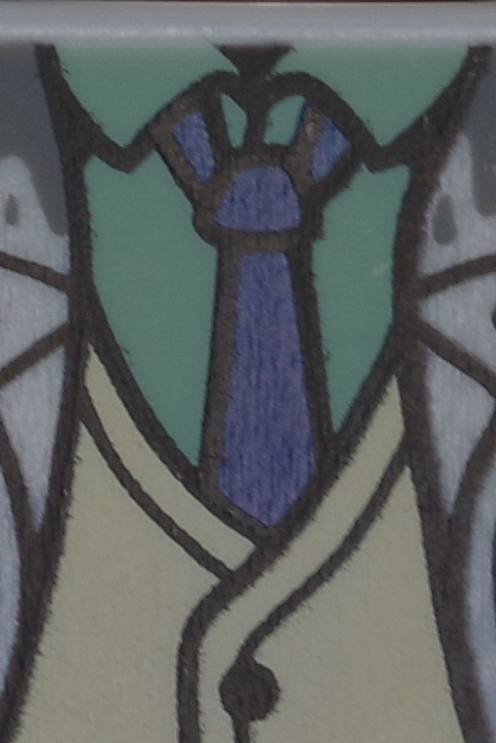 |
F22 | 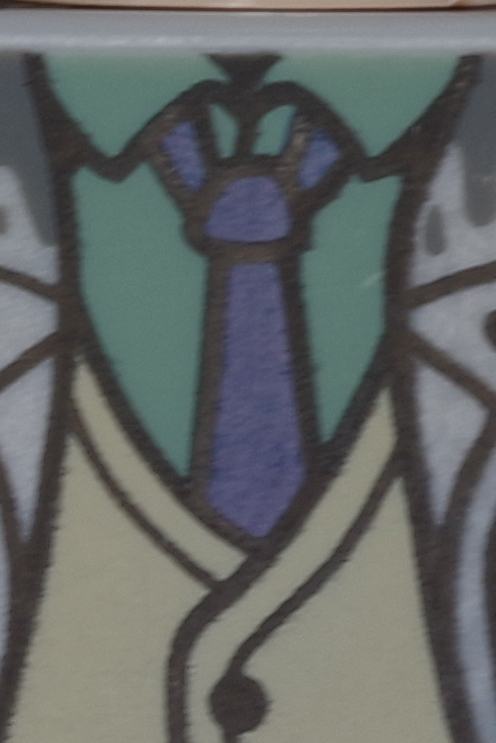 | 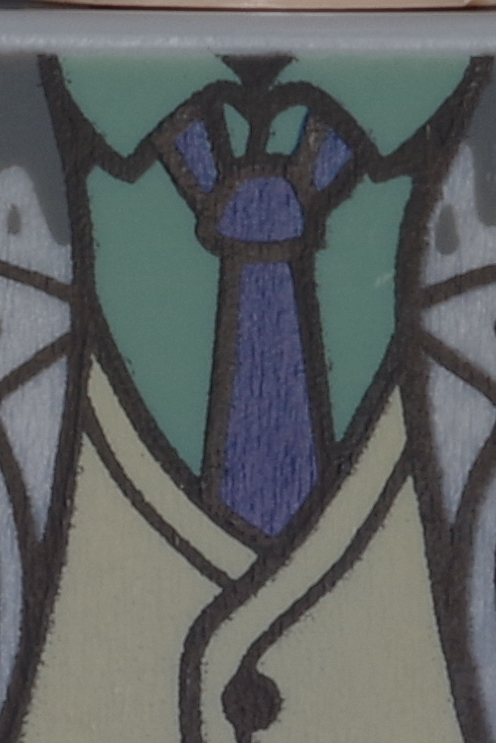 |
Edge
HD 100 Macro AW | Edge | |
F2.8 | 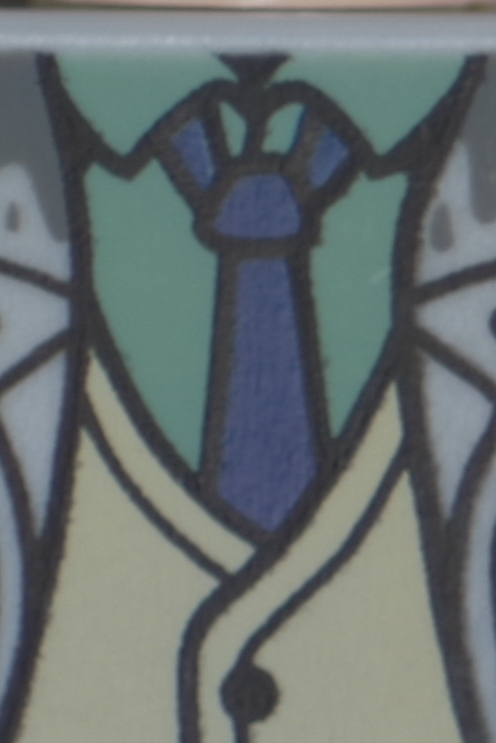 | 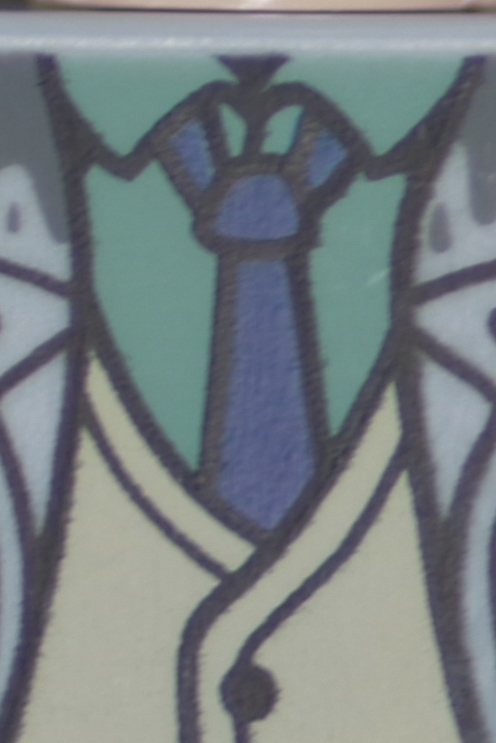 |
F4 | 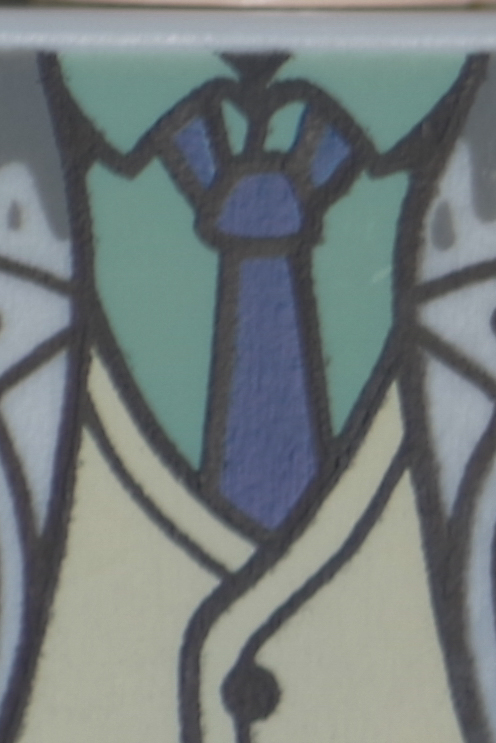 |  |
F5.6 | 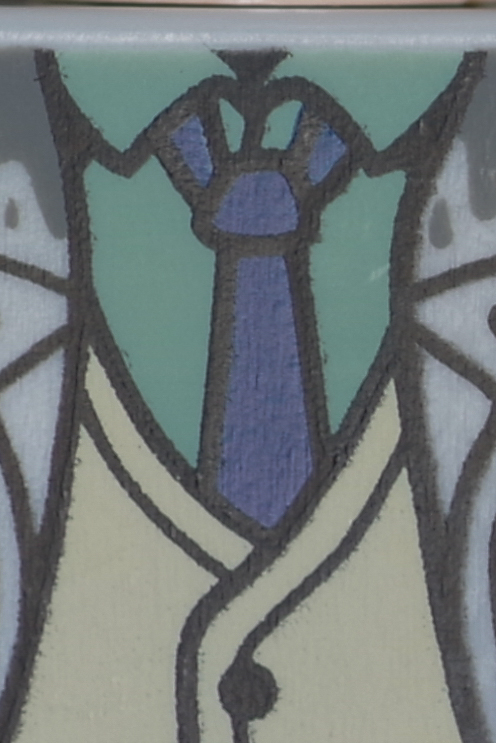 | 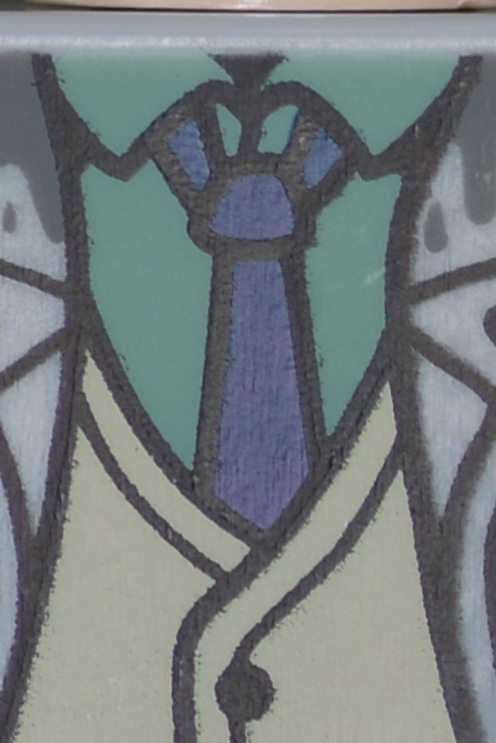 |
F8 | 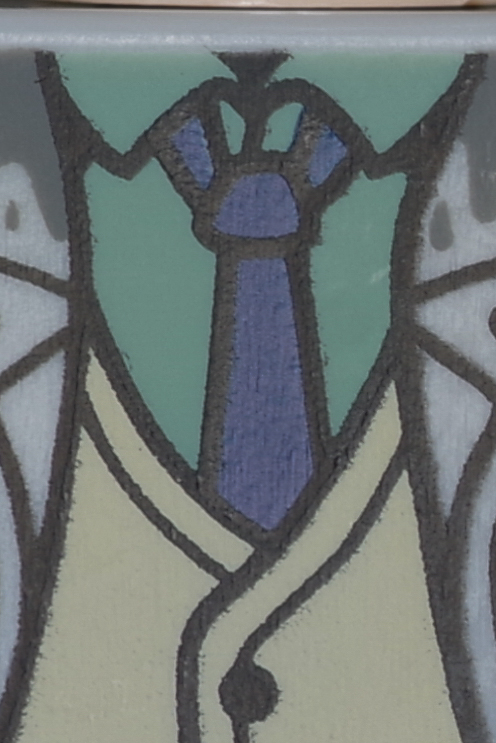 |  |
F11 | 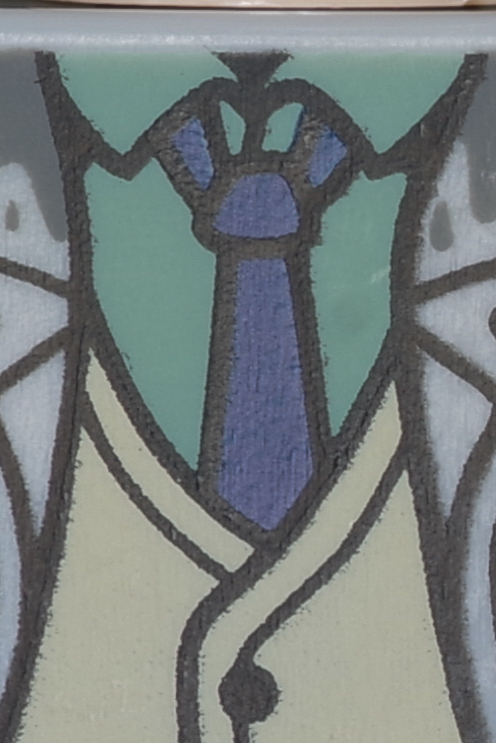 | 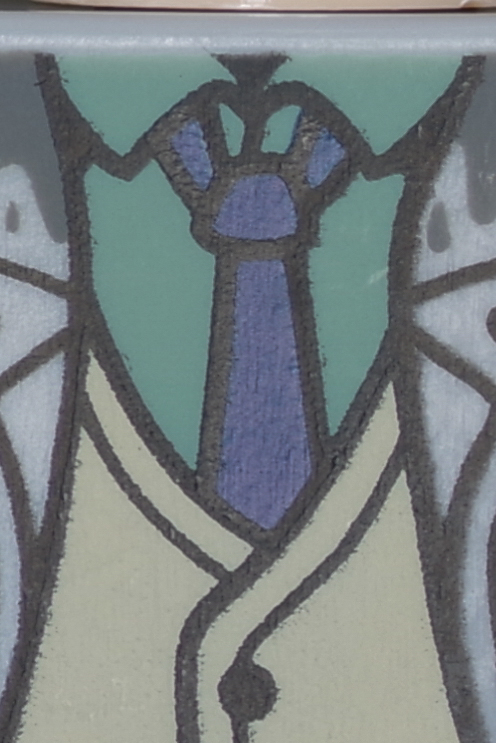 |
F16 | 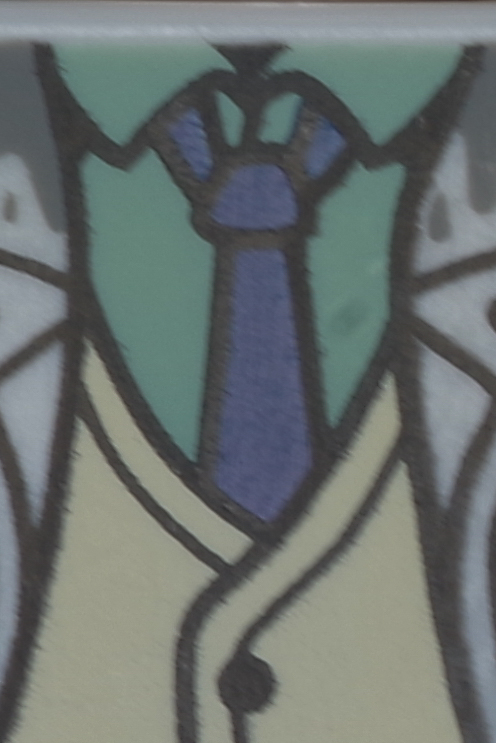 | 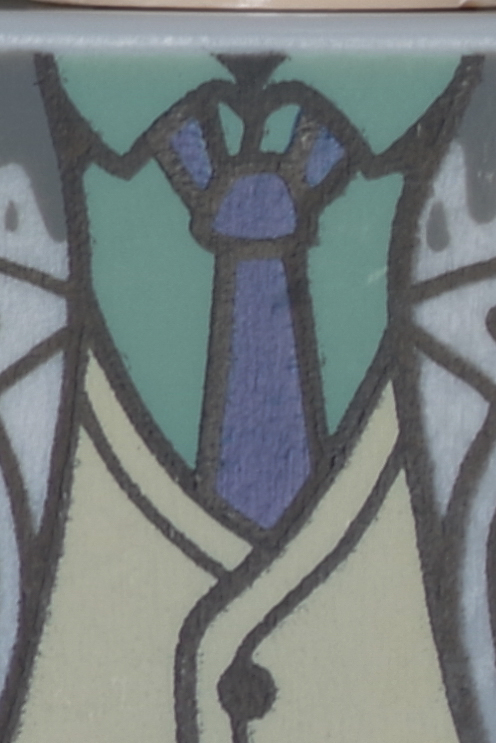 |
F22 |  | 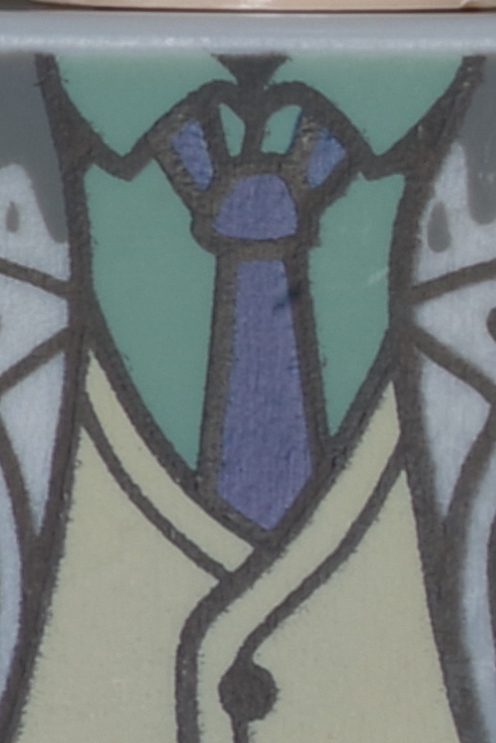 |
Corner
HD 100 Macro AW | SMC 100 Macro WR | |
F2.8 | 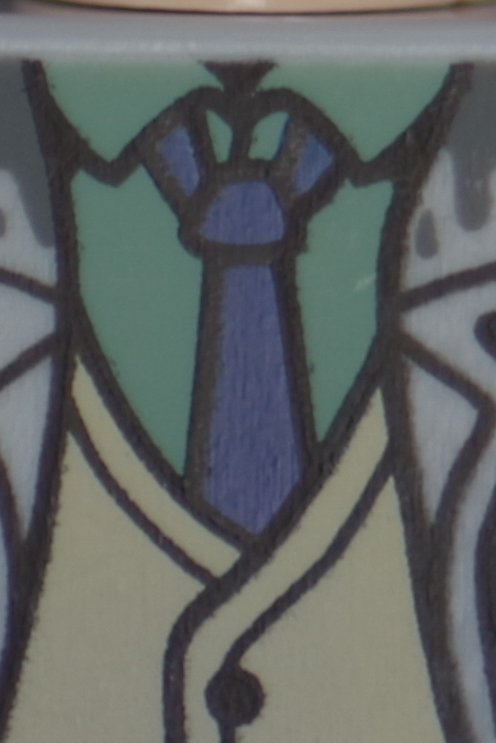 | 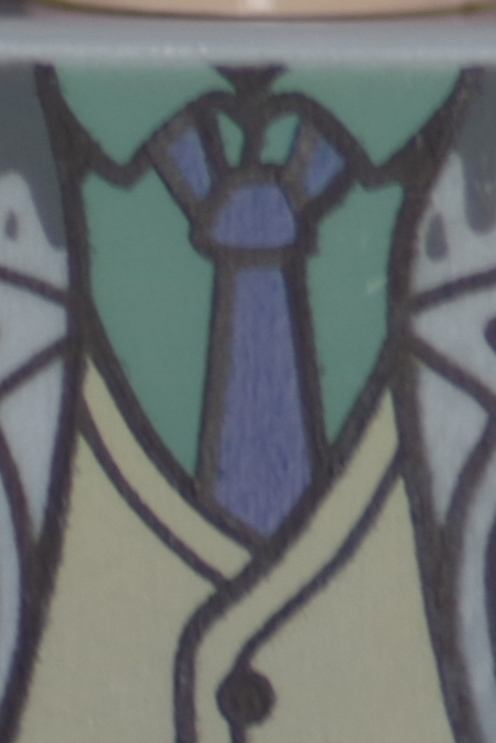 |
F4 | 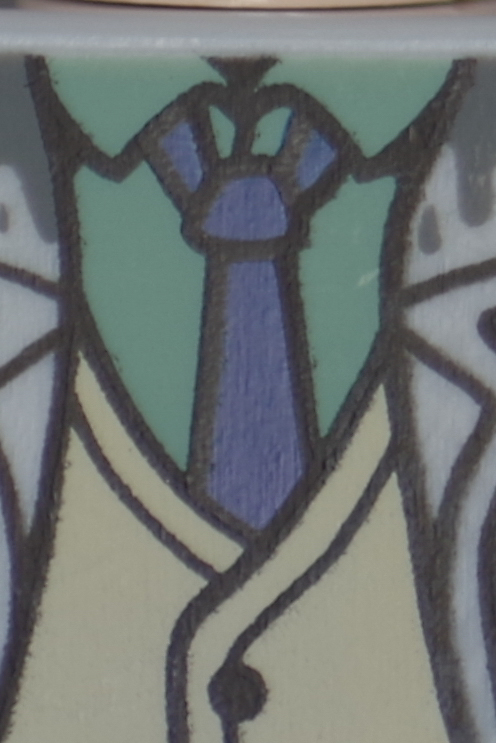 | 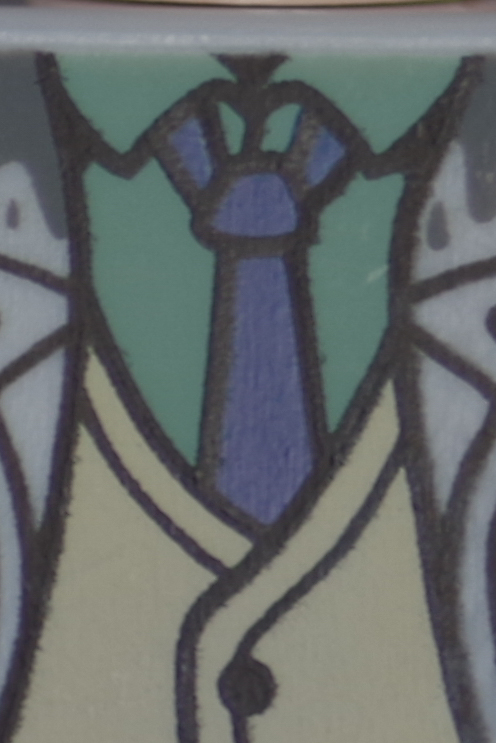 |
F5.6 | 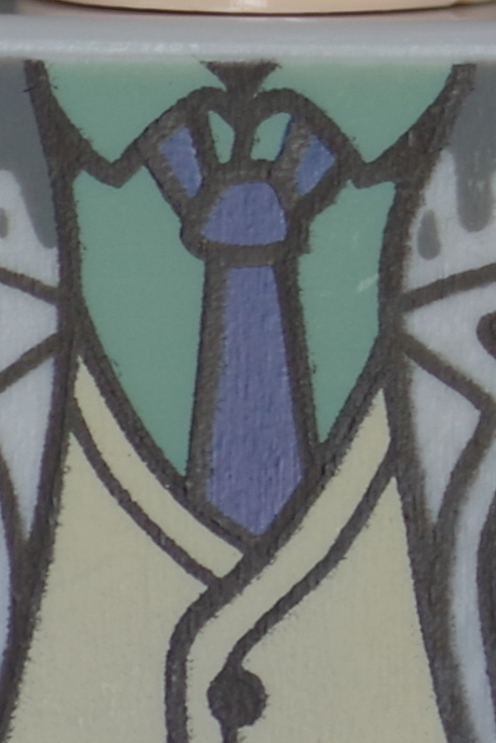 | 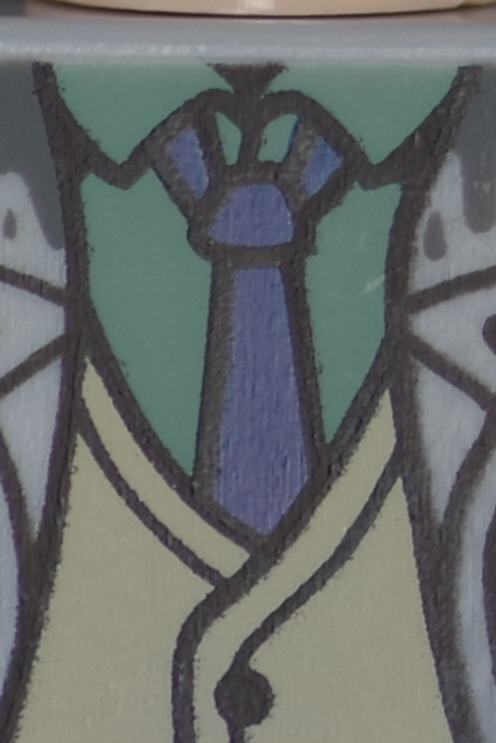 |
F8 |  | 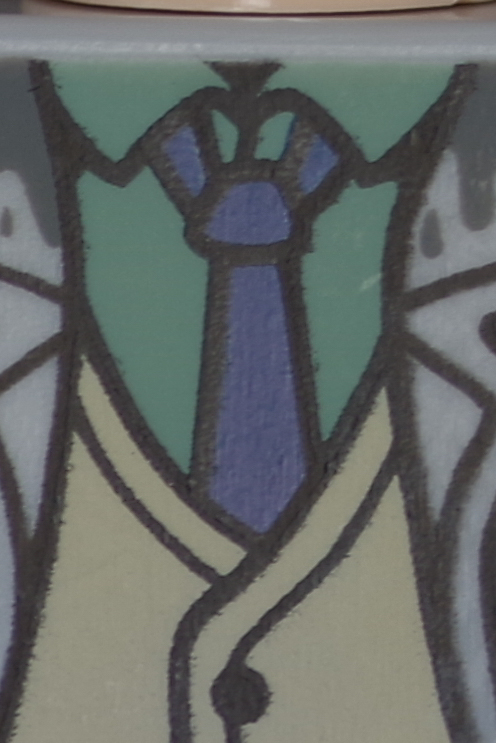 |
F11 | 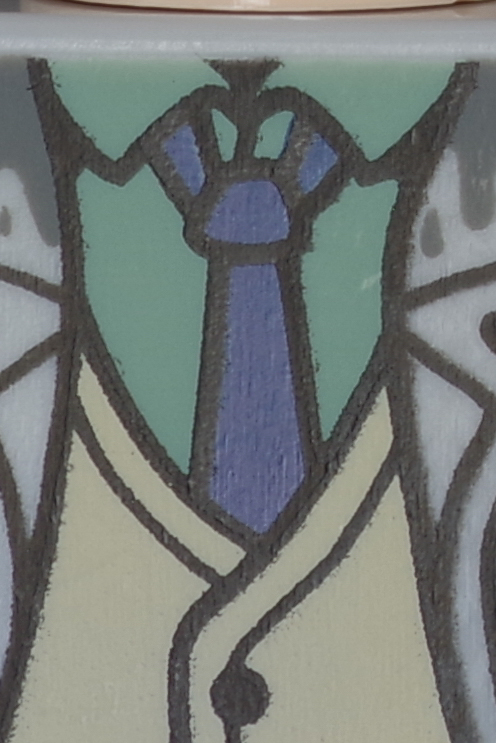 | 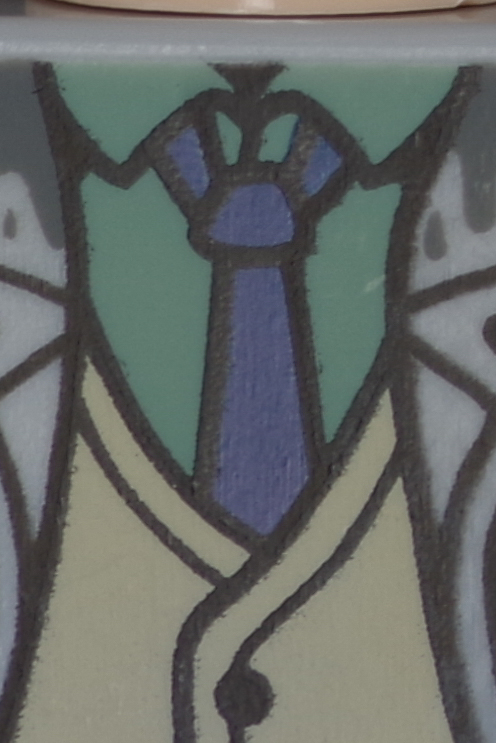 |
F16 | 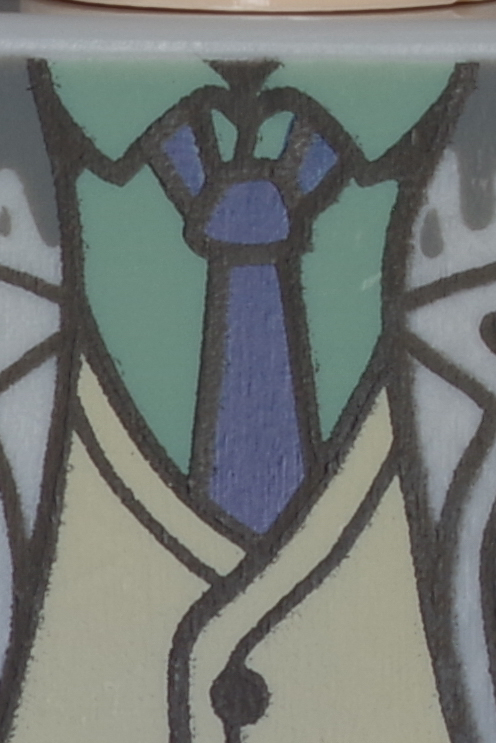 |  |
F22 | 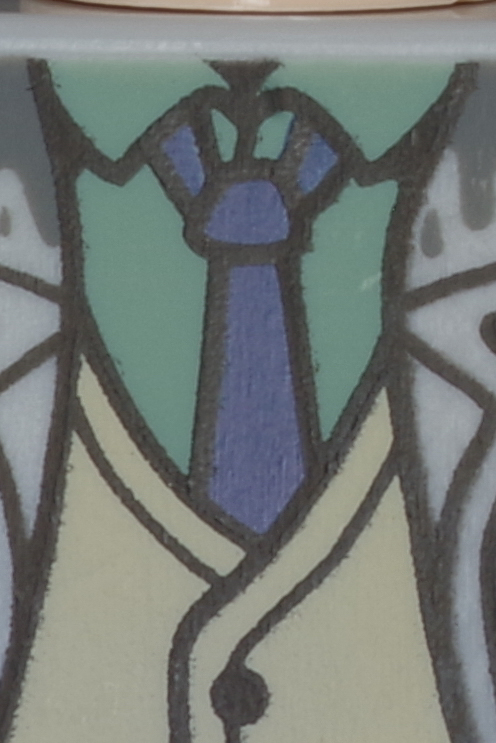 | 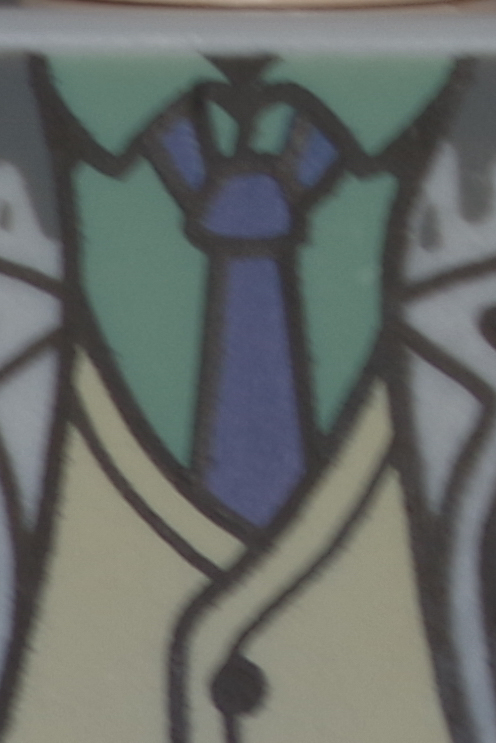 |
The results observed with the test chart are repeated here. Center sharpness is excellent, and details on an actual subject are high throughout. Differences between the two lenses are hard to notice, except at F2.8.
Edges are mostly similar, with a slight advantage to the HD lens at wider apertures and the reverse at smaller apertures.
Corners here with a color subject instead of a star chart show better results from the HD lens.
Summary
Both versions of the D FA 100mm's resolution figures are impressive in the center at all apertures below F16. The HD version does better at F2.8, and there are no true differences beyond that.
Edges and corners are mostly similar again, with lower resolution figures than the center. Real-life tests show a slight advantage to the HD D FA 100mm.

